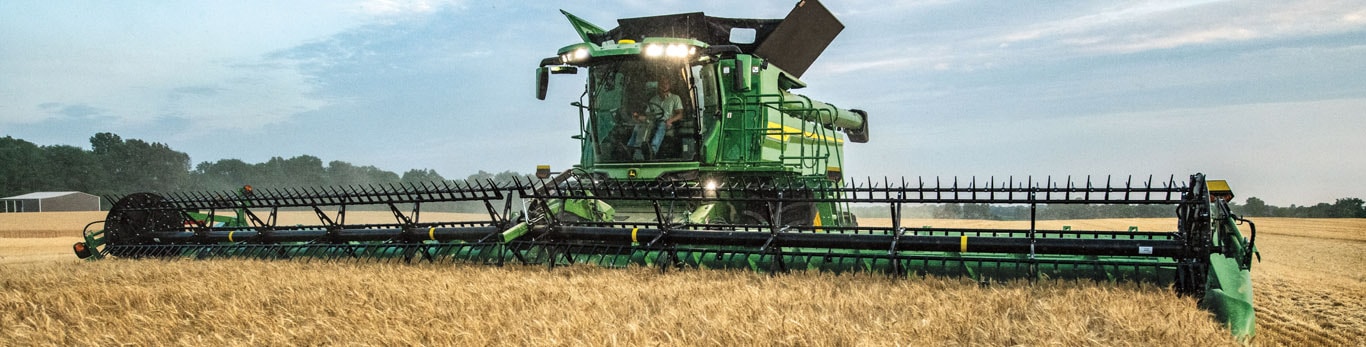
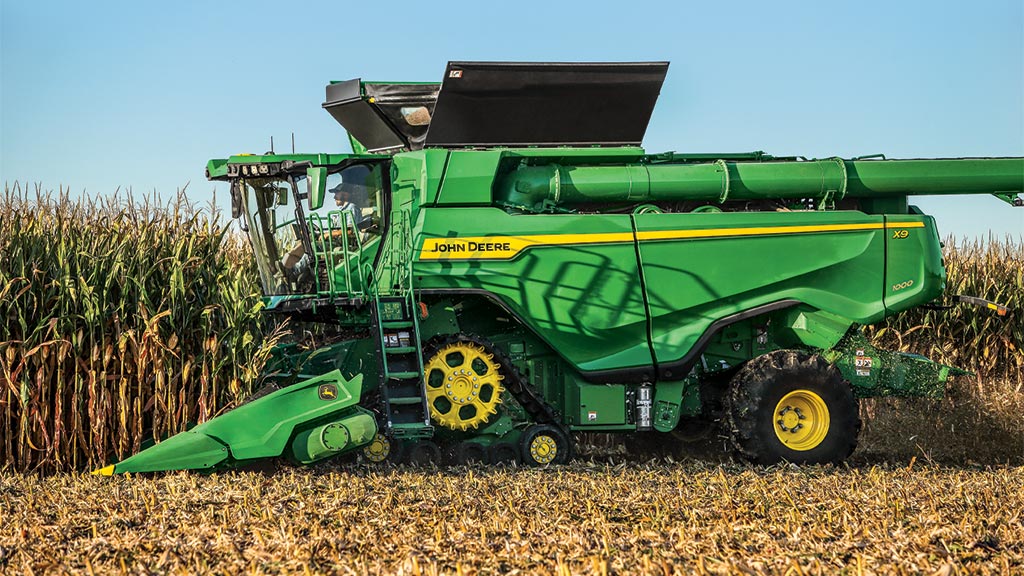
Different crops. Different fields. Different size of operations. Yeah, that doesn't matter to Deere users, because we have a combine for whatever you need. From the grain-eating X9 to the versatile, all new S7, every piece of iron we make is packed with the same legendary John Deere dependability and brains to bring more automation – more productivity – to any farm, any size.
Headers & Platforms
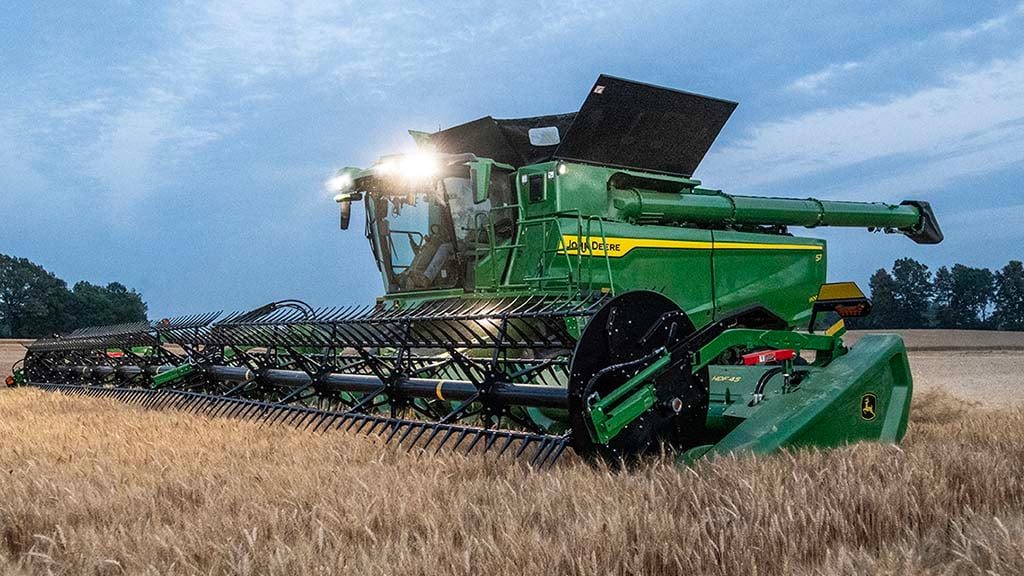
Drapers
We’ve added new drapers to our lineup, to help you reduce loss, consistently maintain desired cut height and put more grain in your tank. Now with a complete draper line that includes sizes from 25 feet (7.6 m) to 50 feet (15.2 m), John Deere offers the biggest selection of draper heads for the widest range of crops and conditions.
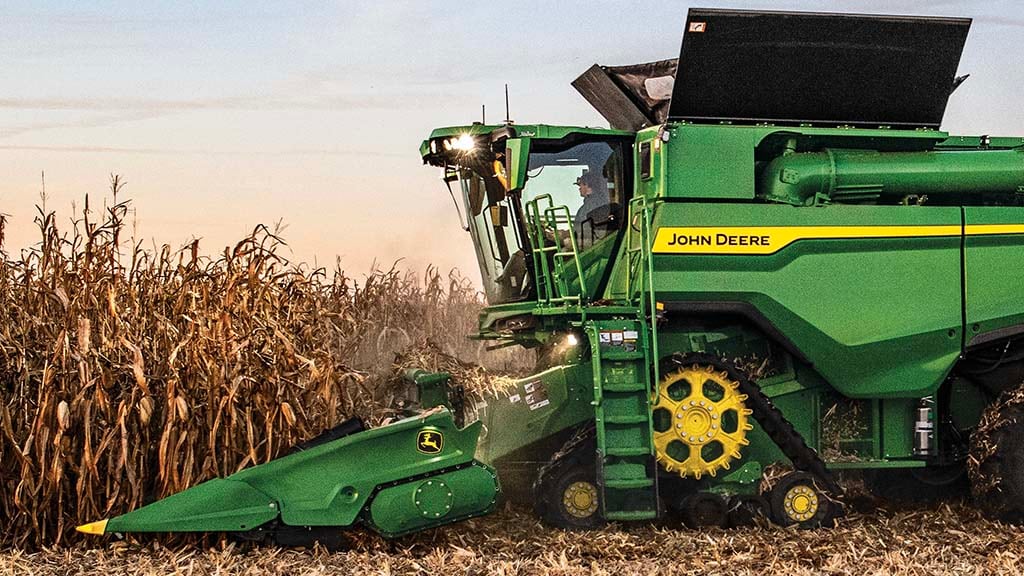
Corn Heads
More acres, higher yields and hybrids with tougher stalks are real challenges at harvest. That's why our corn heads are robust enough to cut the toughest, thickest crop with ease to help ensure every kernel makes it inside the combine.
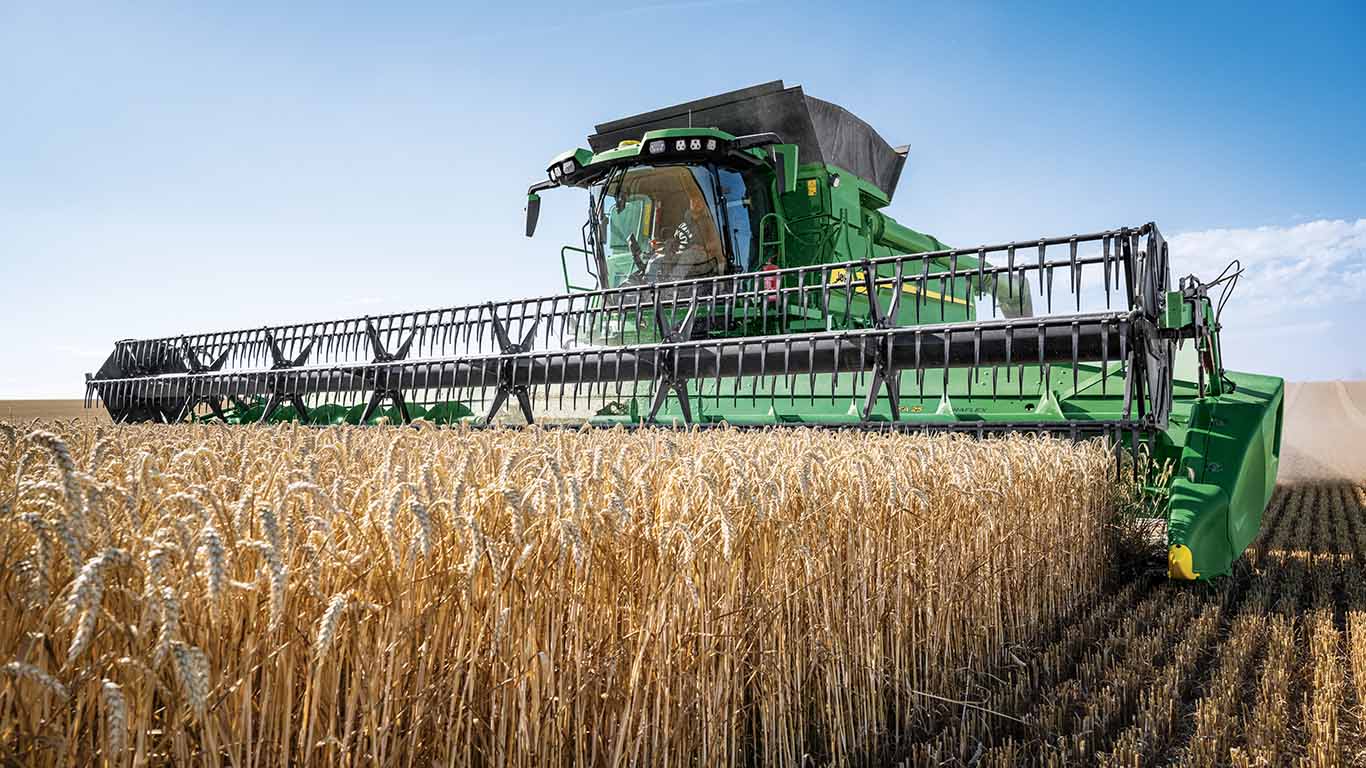
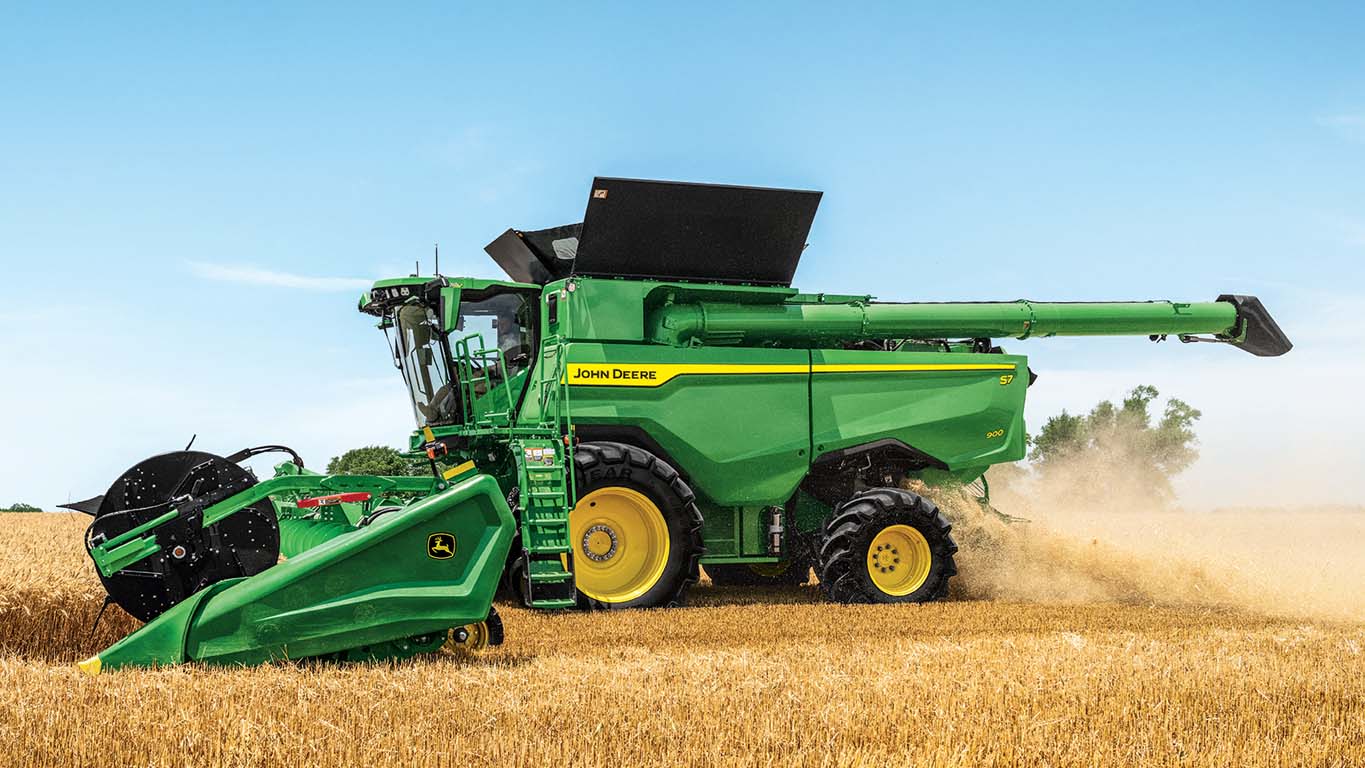
Auger Platforms
Our auger platforms are engineered to match the high capacity of the S7 Combines and are equipped with a range of performance boosting features. Exclusive HydraFlex™ Platforms give you unmatched flexibility to run faster and cut cleaner over uneven ground.
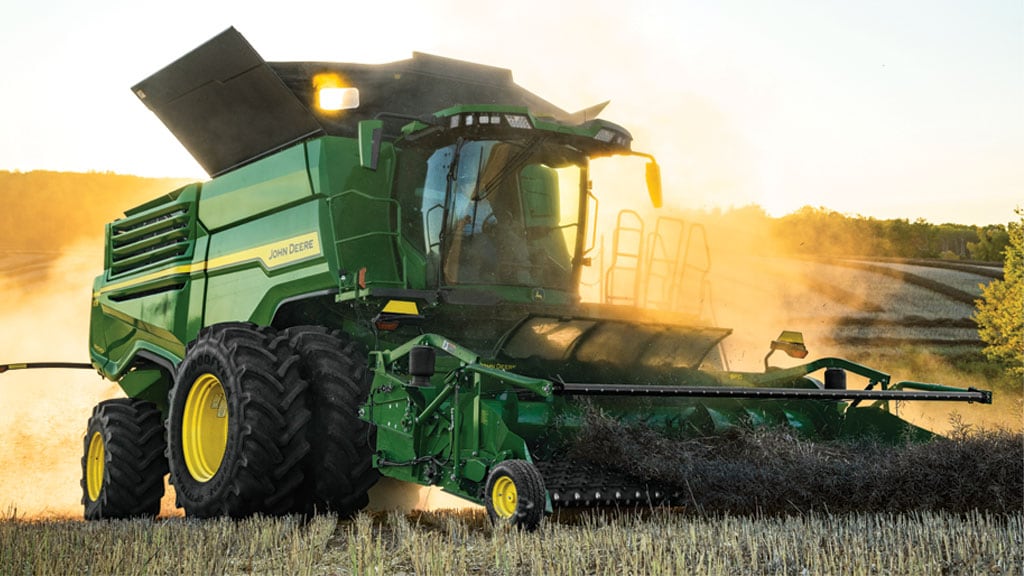
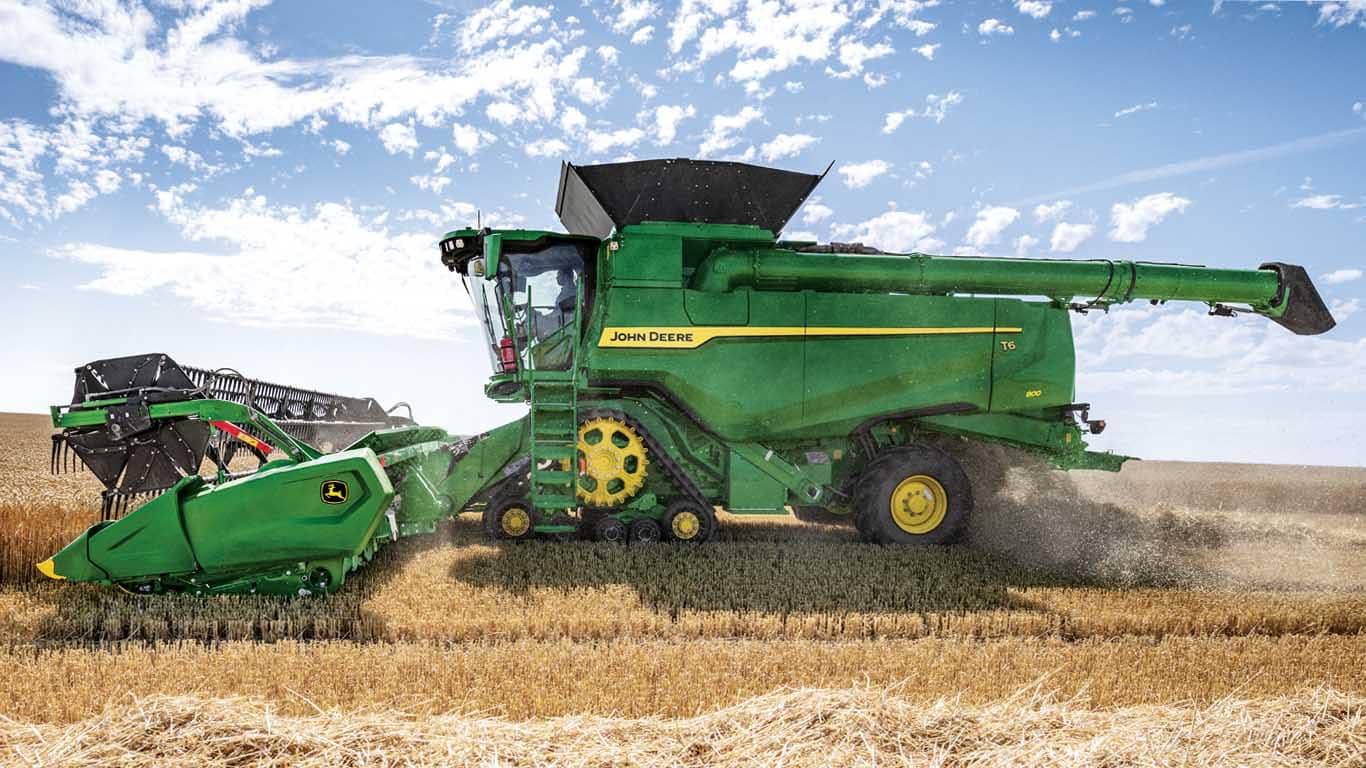
Belt Pickup
No matter how rough the field or how thick the windrows, the BP15 Belt Pickup gives you smooth, complete gathering of windrowed grain, thanks to a variety of exclusive features and innovations.
Mobile Apps
You can't always be in the cab, but you can always have access to the information you need with our mobile apps. You can download these apps in the John Deere App Center (available in the iTunes and Google Play stores).
John Deere Operations Center™
The number of hours in a day isn't always enough to get everything done. That's why we've made it easy to collect, use and share your data wherever you are with the Operations center mobile app.
Connect Mobile
With the Connect Mobile app for harvest, you can manage job quality while it's occurring. It now features dual map view - so you can easily compare two maps side-by-side. This lets you correct issues while you're running in the field, instead of discovering them later, when it will cost you time and money.

Equipment Mobile
John Deere Equipment Mobile takes machine optimization to the next level through proper machine setup, maintenance, and in-field procedures. The app also provides setup information for displays, receivers, and AutoTrac™, plus tools for connecting your machine wirelessly for data transfer and dealer support.